- Price of XRP could test negative trend and go below $0.47.
- Despite strong selling pressure, optimistic measures indicate investor confidence.
With its price rising by more than 2%, XRP had a good week. But as a bearish pattern appeared on the token’s chart, the volatility decreased and the recent slow-moving price action may only be a preamble to a southbound price movement.
Ahead of Us: Bearish Patterns
The momentum of XRP has somewhat decreased, according to CoinMarketCap data, with the price very slightly changing within the previous 24 hours. XRP was the seventh-biggest cryptocurrency as of writing, with a market capitalization of about $29.3 billion.
This current price has slightly decreased to $0.5227 over the last 24 hours; however, it has increased by 2.2% over the previous week.
At the middle of April, when XRP had a big price decline, a bearish pennant pattern developed. Price of the token has since consolidated inside the pattern. Should XRP test this pattern, the price action may quickly become negative and fall below the lower trendline, which would propel the price even farther south.
The exchange inflow of XRP spiked multiple times last week, according to Santiment’s data, implying strong selling pressure and investor dumping of the asset.
Furthermore, on May 24, XRP’s NVT ratio increased dramatically, raising the possibility that the coin is overpriced. Usually, an overvalued asset suggests a price decline. The MVRV ratio fell recently as well, which heightened the pessimistic outlook.
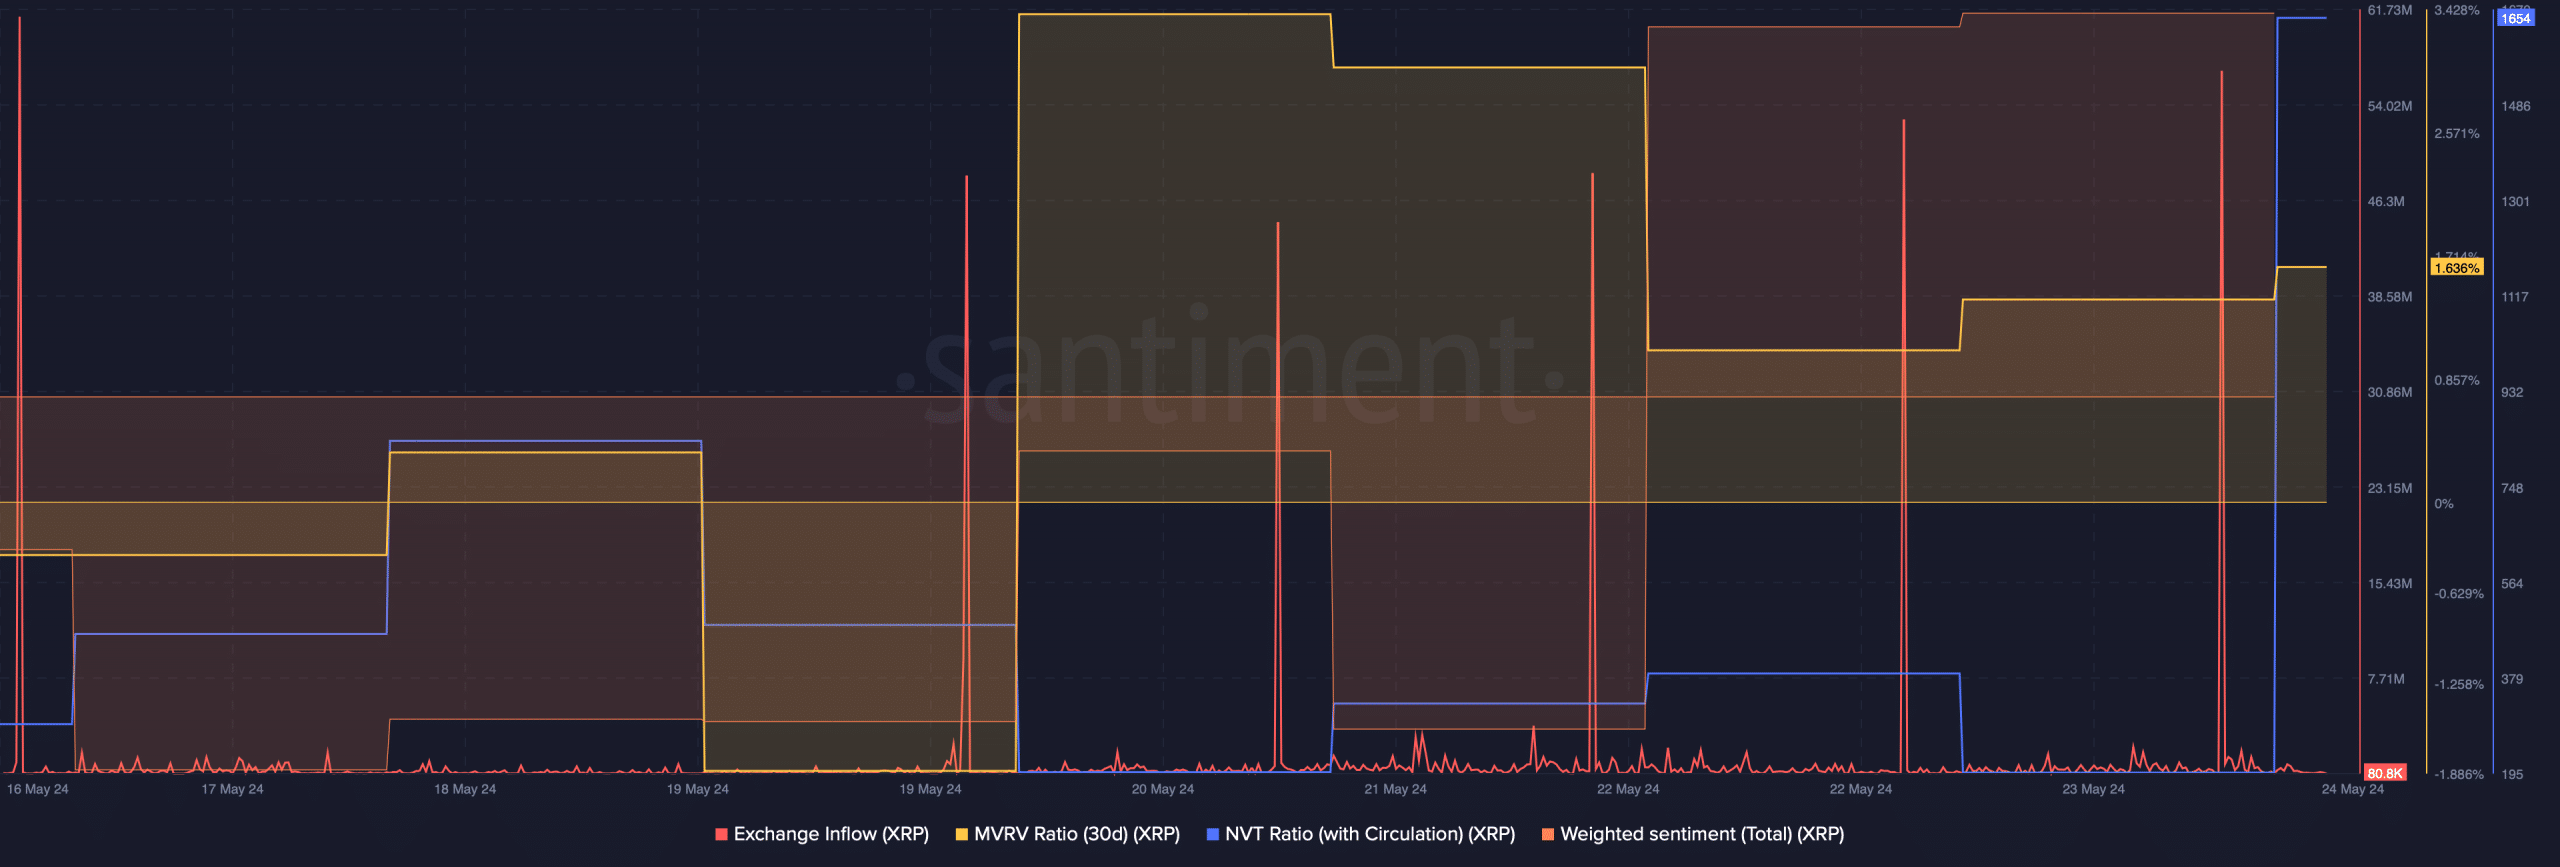
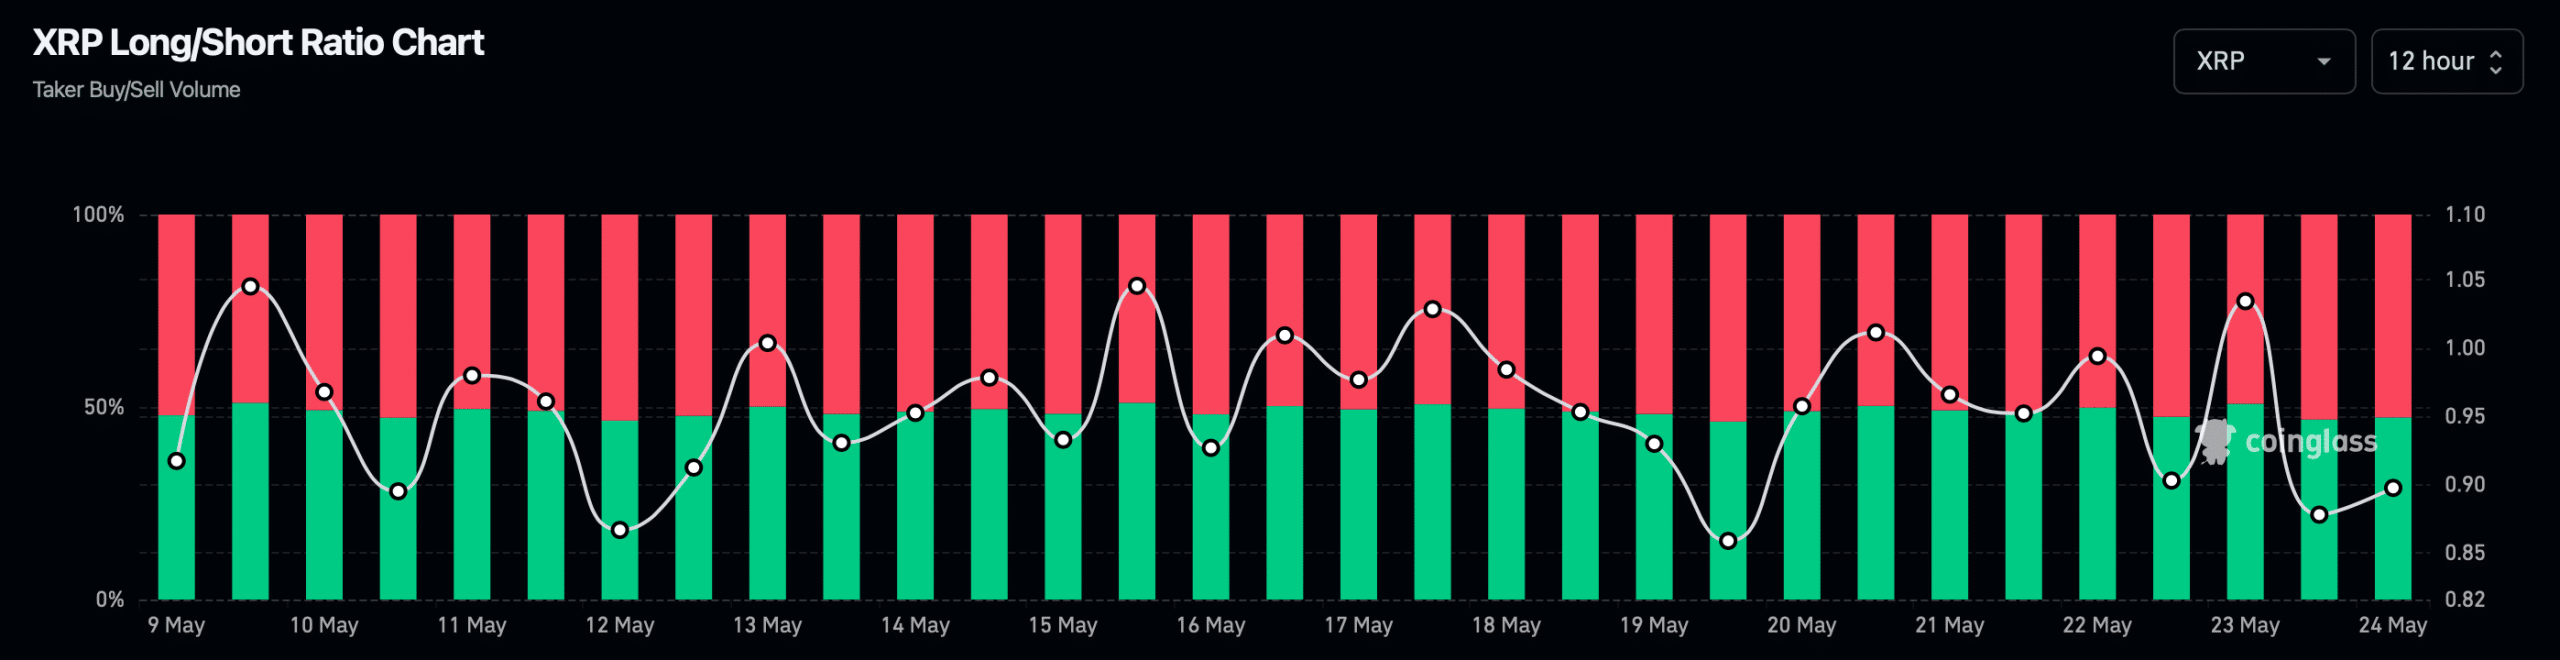
Though these were depressing signs, several measures appeared promising. The weighted sentiment of the token rose, indicating that investors were still optimistic while bullish mood ruled the market. Coinglass data showed that the long/short ratio of XRP rose during the previous 12 hours, which is a positive indication and implies that investors are more inclined to purchase the asset.
Possible Price Waves
In order to determine if XRP will soon go bearish, let’s look at its daily chart. We saw that, following a decline, its Chaikin Money Flow (CMF) increased. Furthermore, moving northward, the Money Flow Index (MFI) suggested that prices would increase.
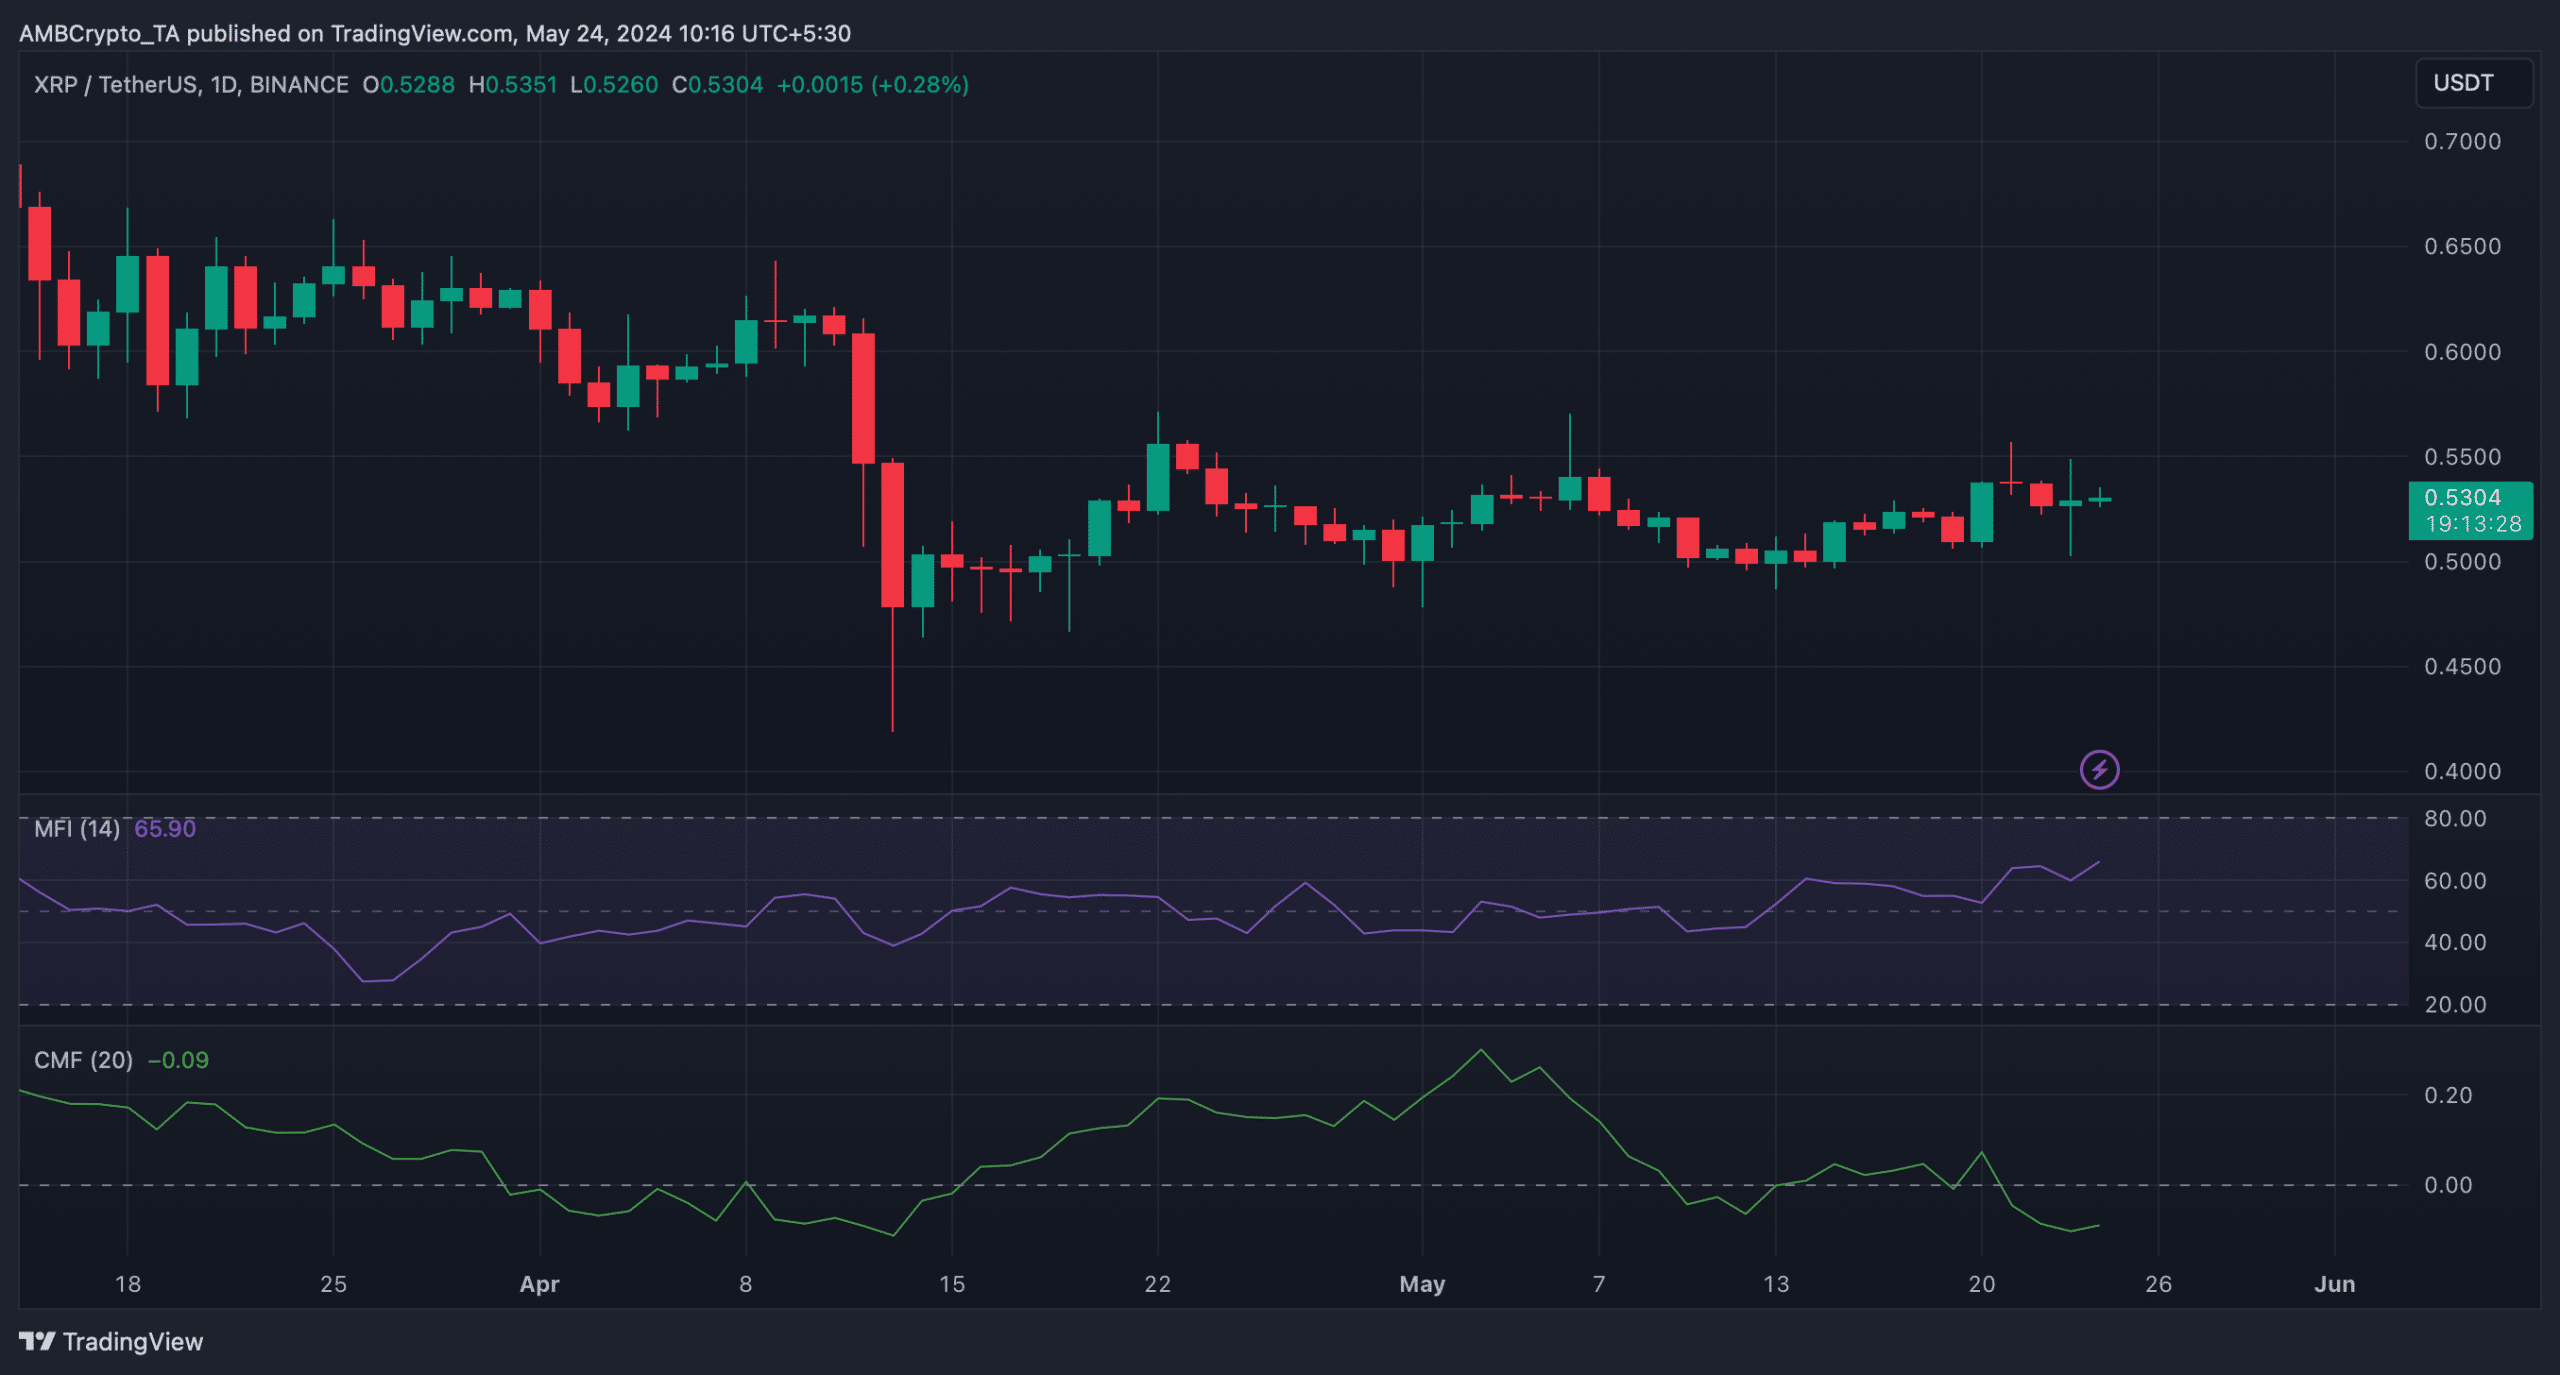
Should these signals turn out to be reliable, XRP may decide to stay bullish and avoid testing the bearish pennant formation. Because strong liquidation at this level frequently causes market corrections, XRP’s price might initially reach $0.544 should the bullish trend continue. Conversely, XRP may fall to $0.47 in the next few days if it tests the bearish trend.
On the other hand, Ripple Whale has moving 50 million XRP to centralized exchanges following the passage of the FIT21 bill, as previously highlighted by CNF.