
Bitcoin (BTC) price, at the helm of the crypto top three, is leading Ethereum (ETH) and Ripple (XRP) prices south as the market shows weakness. All eyes remain peeled on the US Securities & Exchange Commission (SEC) as the eight-day window experts say the financial regulator has to approve a spot Bitcoin exchange-traded funds (ETFs) elapses in just about three days.
Crypto ETF FAQs
An Exchange-Traded Fund (ETF) is an investment vehicle or an index that tracks the price of an underlying asset. ETFs can not only track a single asset, but a group of assets and sectors. For example, a Bitcoin ETF tracks Bitcoin’s price. ETF is a tool used by investors to gain exposure to a certain asset.
Yes. The first Bitcoin futures ETF in the US was approved by the US Securities & Exchange Commission in October 2021. A total of seven Bitcoin futures ETFs have been approved, with more than 20 still waiting for the regulator’s permission. The SEC says that the cryptocurrency industry is new and subject to manipulation, which is why it has been delaying crypto-related futures ETFs for the last few years.
Bitcoin spot ETF has been approved outside the US, but the SEC is yet to approve one in the country. After BlackRock filed for a Bitcoin spot ETF on June 15, the interest surrounding crypto ETFs has been renewed. Grayscale – whose application for a Bitcoin spot ETF was initially rejected by the SEC – got a victory in court, forcing the US regulator to review its proposal again. The SEC’s loss in this lawsuit has fueled hopes that a Bitcoin spot ETF might be approved by the end of the year.
Bitcoin price eyes 5% slump unless a spot BTC ETF launches
Bitcoin (BTC) price could fall 5%, or not, depending on what the US SEC decides to do in the next three days. Whether it will be a yay or nay in regard to the spot Bitcoin exchange-traded funds (ETFs) will be the determining factor as the detailed eight-day window closes fast.
Meanwhile, a 5% slump seems likely for Bitcoin price amid falling momentum. It comes amid buyer exhaustion after BTC was massively overbought. With the Relative Strength Index (RSI) and the Awesome Oscillator (AO) supporting the downside, BTC could slide to test the support confluence between the 25-day Exponential Moving Average (EMA) and the horizontal line at $34,483 before a possible bounce.
In a more dire case, the slump could crack past $34,483 to test the 50-day EMA at $32,332. Selling pressure could see Bitcoin price lose critical support at $31,190. A daily candlestick close below this level would invalidate the bullish thesis.
BTC/USDT 1-day chart
On the flipside, increased buying pressure, which would happen if the SEC approves the launch of a spot BTC ETF, could send Bitcoin price north, clearing the range high at $37,972 to bring the $40,000 psychological level into sight.
Also Read: Bitcoin rages on, $40,000 may not be a hopium pipe dream for BTC after all
Ethereum price must hold above ascending trendline to realize upside potential
Ethereum (ETH) price is showing weakness, but the overall trend remains bullish. To realize more gains, the second largest cryptocurrency by market cap must hold above the ascending trendline, which could deliver 5% gains for a test of the $2,136 range high. In a highly bullish case, the gains could stretch to the $2,200 psychological level.
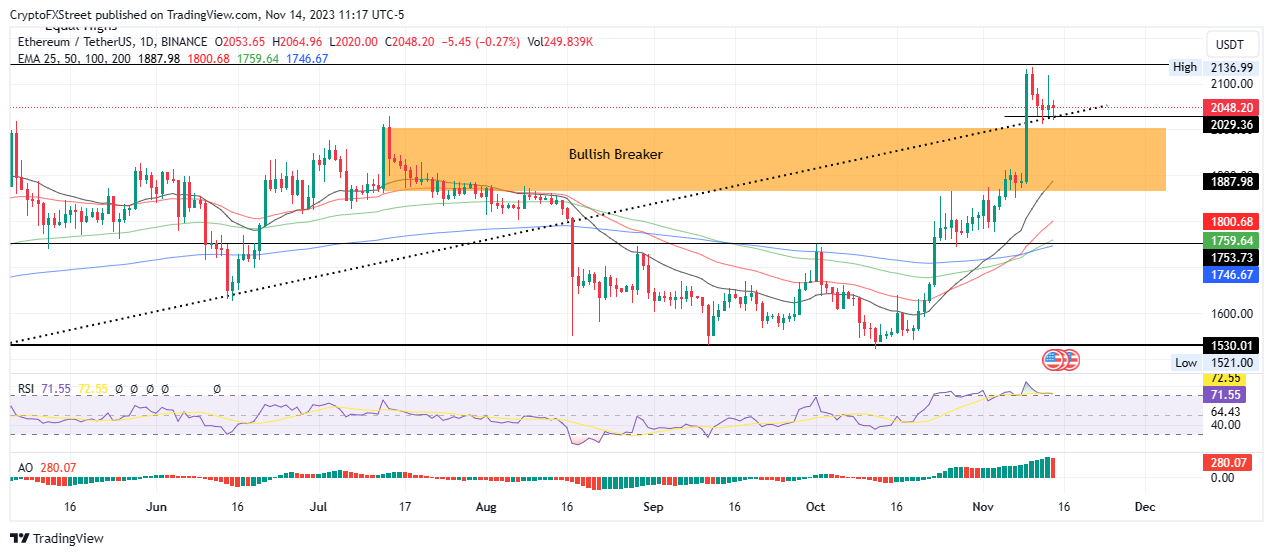
ETH/USDT 1-day chart
On the other hand, increased seller momentum could send Ethereum price below the ascending trendline at $2,029. A break and close below this level could see ETH fall into the supply zone turned bullish breaker. A break and close below its midline at around $1,935 would solidify a continuation south.
Ripple price fills up a triangle
Ripple (XRP) price has filled up a triangle amid reducing volatility in the XRP market. For the next directional bias, investors should wait for a confirmed breakout of this pattern. Meanwhile, all signs point to a downside move, amid falling momentum, indicated by the RSI and the AO histogram bars flashing red.
Increased selling pressure could see Ripple price break the lower trendline of the triangle to test the 25-day EMA at $0.6187. If the 25-EMA fails to hold as support, the slump could extend for XRP to tag the $0.5981 support level, 10% below the current price. A break and close below this level would clear the path for the remittance token to spiral further, slipping past the 50-day and 100-day EMAs at $0.5837 and $0.5619, respectively, to fall into the consolidation range between $0.5392 and $0.4735.
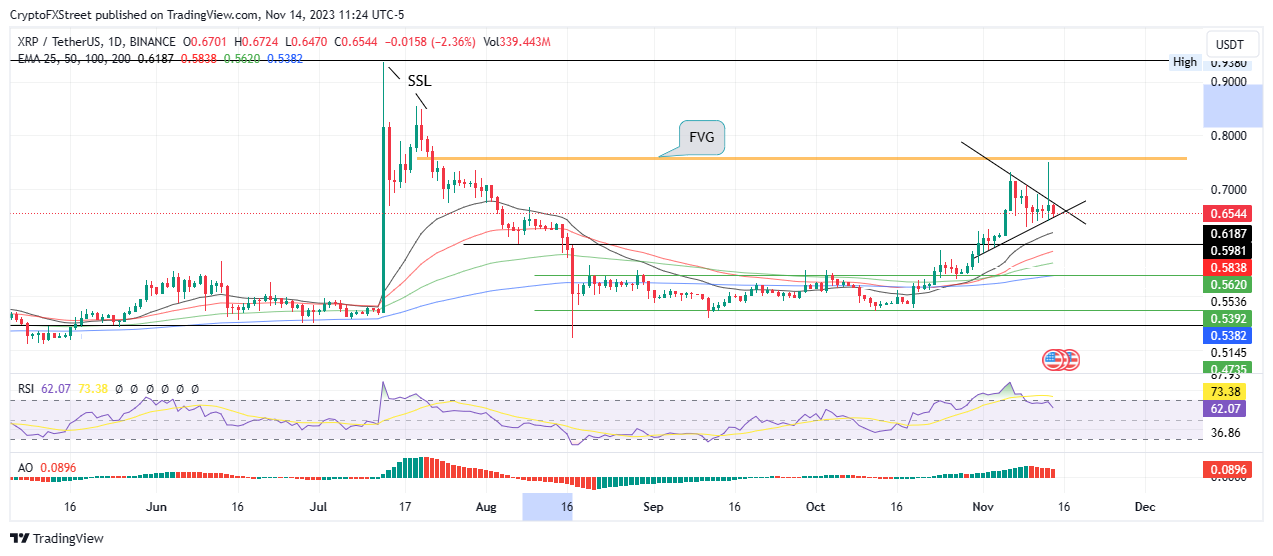
XRP/USDT 1-day chart
On the flipside, a break above the upper trendline could see Ripple price stretch to reclaim the November 13 high of $0.7500. In a highly bullish case, it could break past the Fair Value Gap (FVG) ranging from $0.7519 to $0.7623, restoring balance before tagging the $0.8000 psychological level. Such a move would constitute a 20% climb above current levels.
Also Read: SEC v. Ripple lawsuit still drags on, Judge Torres sets schedule for 2024