
The Litecoin (LTC) price has fallen since the middle of February but is trading inside a short-term bullish pattern.
Even though the pattern could cause an initial bounce, it is likely that the long-term trend is still bearish.
Litecoin Price Shows Bearish Signs at Resistance
The price of LTC has been increasing since June 2022. It reached a yearly peak of $105.80 in February 2023.
However, it could not surpass the long-term horizontal resistance level at an average price of $100 and was rejected twice (red icons). This rejection resulted in a double-top pattern, which is a bearish pattern that leads to a significant decline.
The price started to fall shortly after the creation of the pattern.
Additionally, the weekly Relative Strength Index (RSI) gives a bearish reading. The RSI is a momentum indicator used by traders to evaluate whether a market is overbought or oversold and to determine whether to accumulate or sell an asset.
Readings above 50 and an upward trend suggest that bulls still have an advantage, while readings below 50 indicate the opposite.
During the double top, a bearish divergence occurred between the Litecoin price and the RSI, which means that an increase in momentum did not accompany the price increase.
Since the RSI is currently at 50, a drop below the line will confirm that the trend is bearish.
LTC Price Prediction: Can Price Reverse Bearish Trend?
The technical analysis from the short-term six-hour time frame gives a more bullish LTC price prediction. So, it allows for the possibility that the price will bounce, at least in the short term. There are three main reasons for this.
First, the price is trading inside a descending parallel channel. These channels usually contain corrective structures, meaning that an eventual breakout from it is the most likely scenario.
The fact that the price trades in the upper portion of the channel increases the likelihood of an eventual breakout.
Next, the Litecoin price reclaimed the $79 support area after previously deviating below it (red circle). Upward movements usually follow these deviations, since they occur when sellers were not able to push the price down.
The $79 support is created by a horizontal support area and the 0.618 Fib retracement support level. Due to this confluence, it is a crucial support area.
Finally, the six-hour RSI is increasing. Even though the indicator is above 50, the fact that it is moving upwards and moved outside of its oversold zone is a bullish sign.
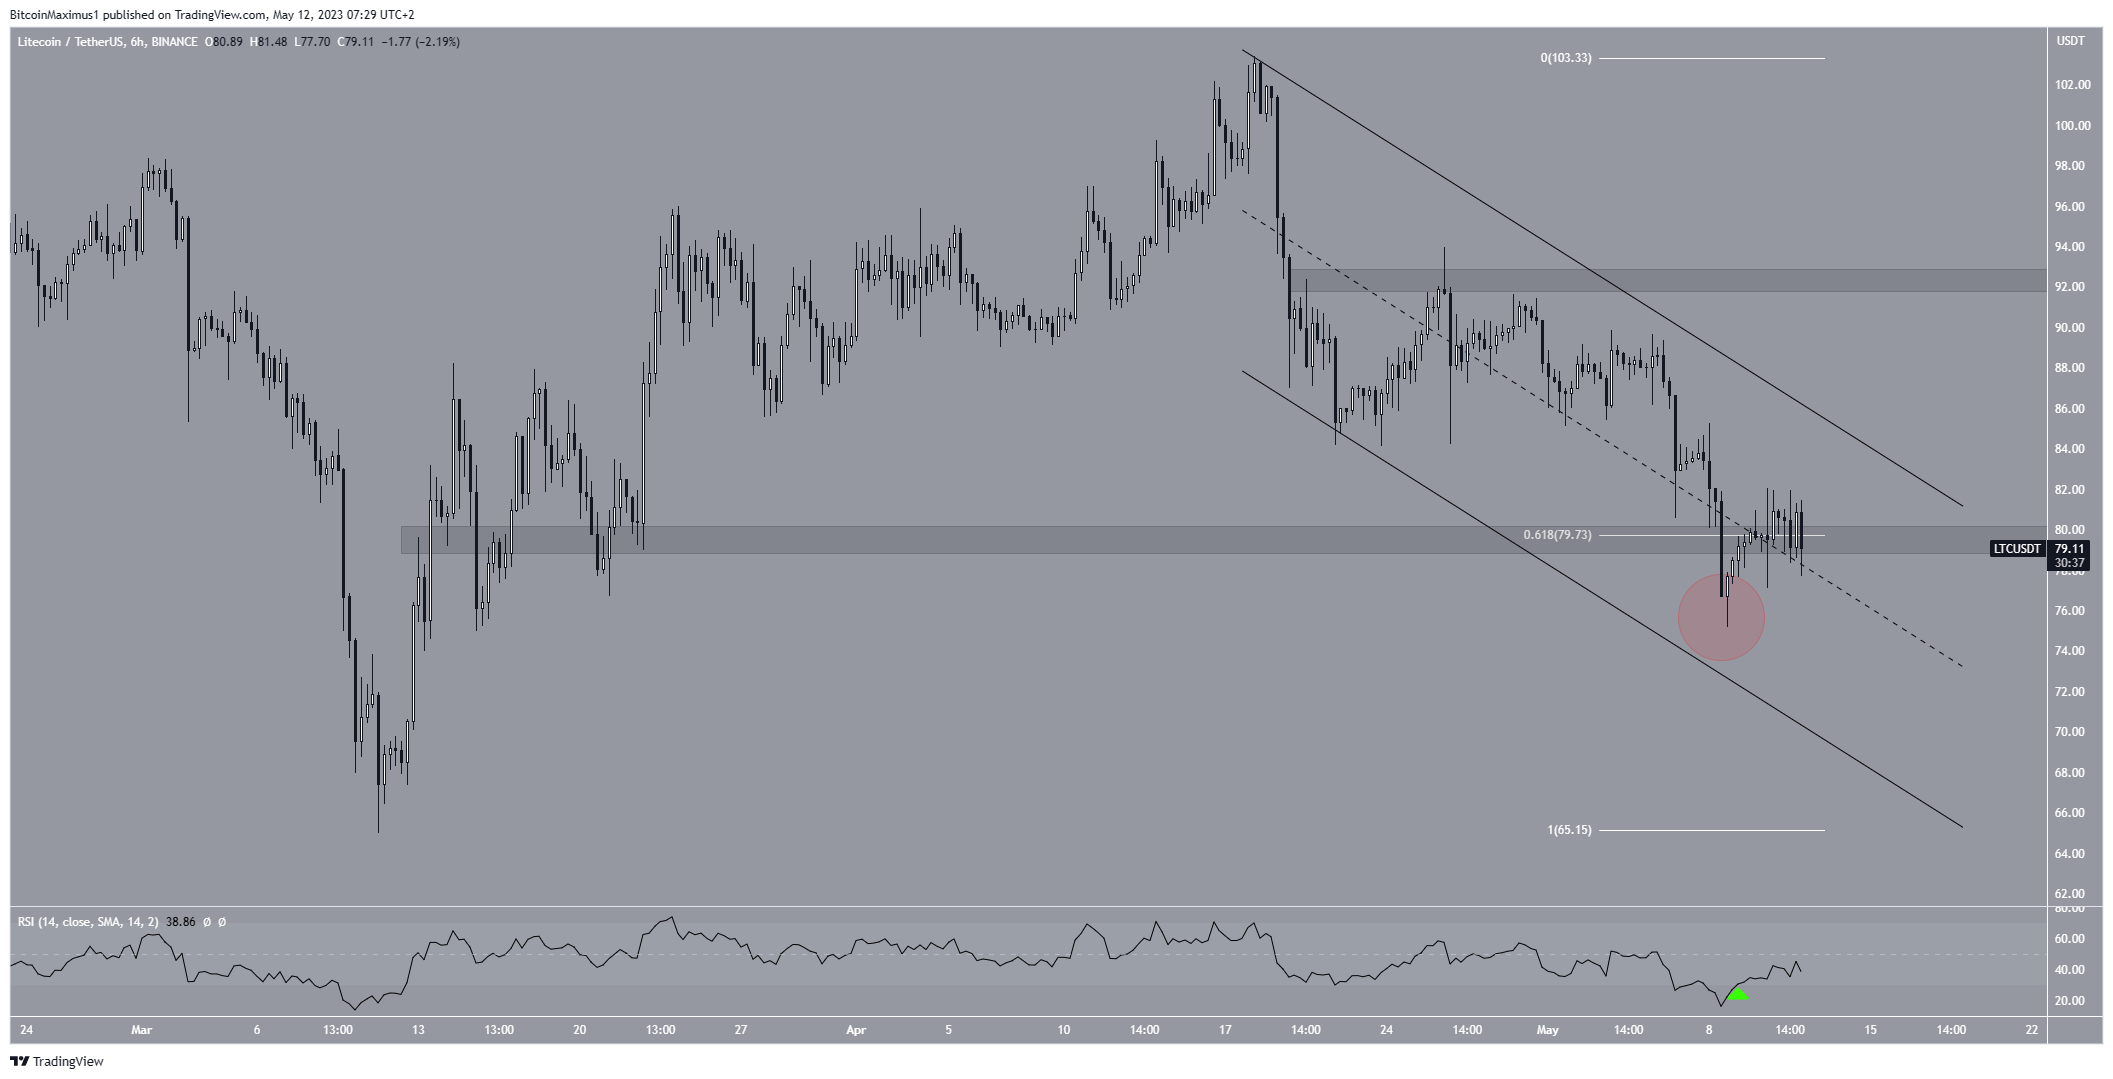
If the price breaks out from the channel, it could increase to the next resistance at $92.
However, a fall below $79 would invalidate the short-term bullish Litecoin prediction. In that case, a decrease toward $68 would be the most likely future price outlook.
For BeInCrypto’s latest crypto market analysis, click here.
Disclaimer
In line with the Trust Project guidelines, this price analysis article is for informational purposes only and should not be considered financial or investment advice. BeInCrypto is committed to accurate, unbiased reporting, but market conditions are subject to change without notice. Always conduct your own research and consult with a professional before making any financial decisions.