The Litecoin price analysis reveals that the market has been following a bullish trend for the past few hours as the bulls have been securing wins consecutively. The LTCUSD pair has now surged above the $88.00 level and is looking to continue its advance. In the past 24 hours, LTC’s price crossed over from $82.32 to $88.35, a gain of 6.43 percent. The coin was earlier found consolidating near the support at $82.32 before the bulls stepped in to make this recovery.
Litecoin price analysis daily chart: Bullish trend is at play
The daily Litecoin price analysis suggests a constant upward trend has been going on for the past week, as the buying activity almost reached its peak point. The bulls have been dominating the price chart for the past 24 hours as well, as the price went above the psychological mark of $88.00 at the moment. The situation is turning more favorable for cryptocurrency buyers, as LTC value is constantly increasing value during the last 24 hours.
Moving on, the moving average indicator is showing its value at $81.72 at present, with 50-MA currently moving above the 200-MA, indicating strong bullish momentum. The RSI indicator is currently at 54.06 and is looking to cross over the 70 levels soon, which would be an indication of extreme buying pressure. The volatility is changing, and the upper value for the Bollinger Bands Indicator is now at $93.37, while the lower band is at $77.32.
Litecoin price analysis: Recent developments and further technical indications
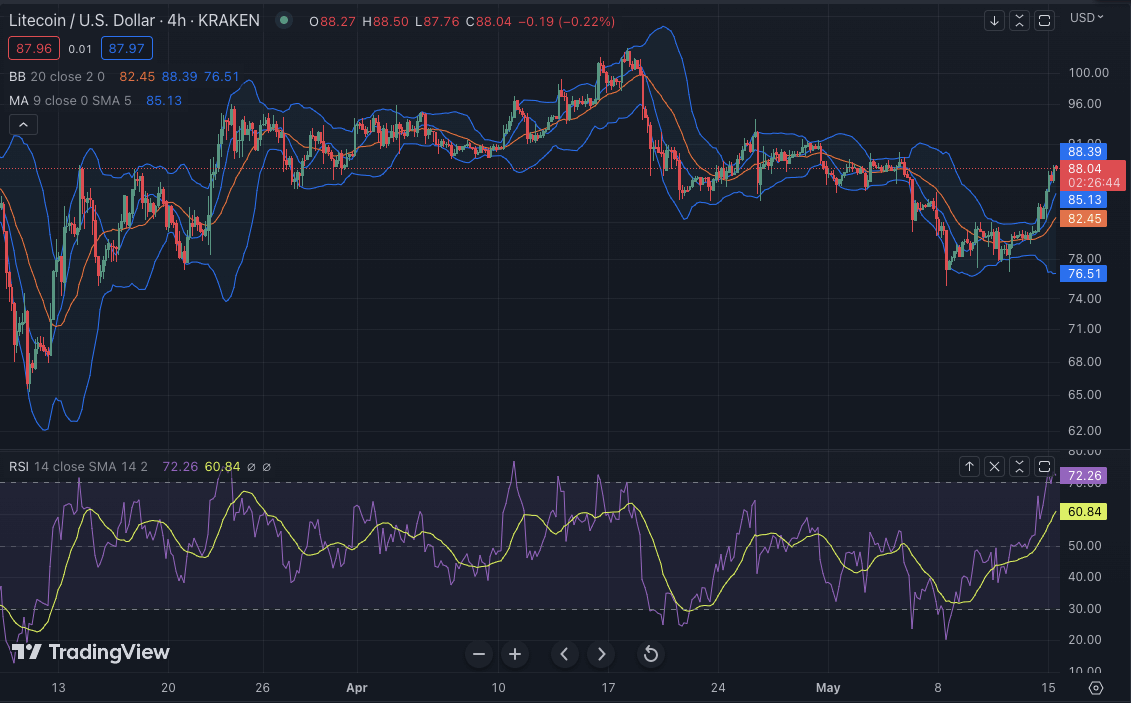
The four hours Litecoin price analysis shows an uptrend as the price has undergone a sufficient improvement in the past few hours. The latest price movement is bullish, and the bulls have managed to maintain their intensifying uptrend. The price is now at a much more stable position, at $88.35, and is expected to reach a further high point in the next few hours.

The moving average value has moved up to $85.13, as the bulls are leading. The RSI indicator confirms an uptrend is in play, and it currently stands at 72.26 indicating that the market is in the overbought region. The Bollinger Bands Indicator is also corroborating the bullish trend, as the upper band has moved up to $88.39 and the lower band stands at $76.51 with a slight increment in volatility.
Litecoin price analysis conclusion
In conclusion, Litecoin price analysis showcases an optimistic path ahead for traders who decide to join this market. The current trend seems to be in favor of the bulls, with buyers maintaining control of the market, as shown by various indicators. However, caution is advised as any slight turn of events can lead to an unpredictable shift in prices.
Disclaimer. The information provided is not trading advice. Cryptopolitan.com holds no liability for any investments made based on the information provided on this page. We strongly recommend independent research and/or consultation with a qualified professional before making any investment decisions.
