
The recent Litecoin price analysis highlights that the bulls have captured the market as buying pressure builds up. LTC has been trading on the positive side and is currently trading at $84.24, up by 1.23%. The market sentiment is positive as the bulls seem to be in the driver’s seat, pushing LTC to recover from its recent dip. However, strong resistance lies at the $84.50 mark, and breaking this level might prove to be difficult for the bulls. If they overcome this level, then there is a high chance of seeing Litecoin rise further. The support level at the $83.01 mark should act as a cushion in case of a correction.
Litecoin price analysis 1-day chart: LTC/USD face a strong resistance at $84.50
The daily chart for Litecoin price analysis indicates that the bulls are fighting an uphill battle. The bulls have been leading the market for the most time today, and the price has been trading above the $83.01 support level. However, the trading volume is still down and the market is yet to witness a breakout.
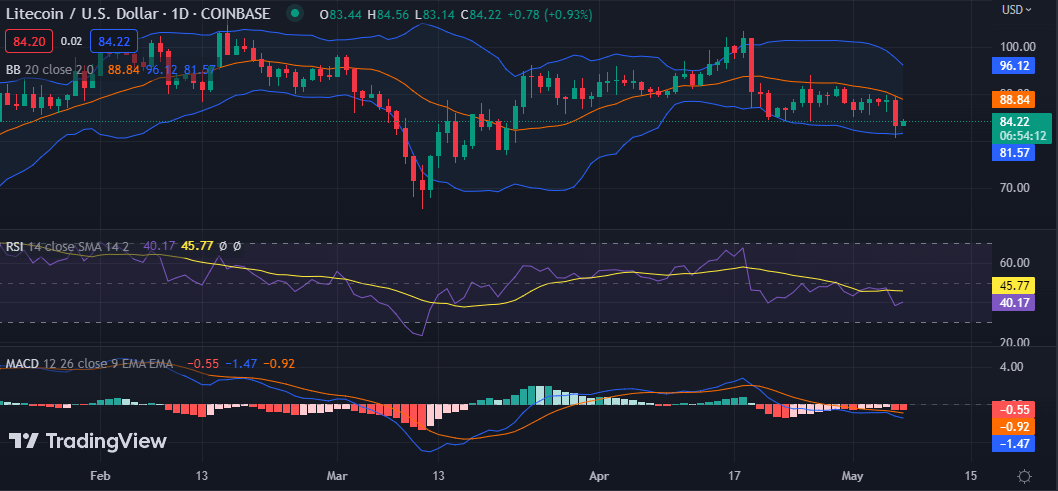
The technical indicators in the daily chart are also reflecting a bullish comeback. The Relative Strength Index (RSI) is showing increasing buying pressure as the indicator has changed direction and slopes upwards. Similarly, the Moving Average Convergence Divergence (MACD) is still in the negative territory with a negative value, but the histogram will slowly push upwards if the bullish trend continues. The Bollinger Bands have shifted upwards as well, signaling a possible price increase.
Litecoin price analysis hourly chart: Recent developments
On the 4-hour chart Litecoin price analysis, we can see that the bulls have gained a foothold in the market as buying pressure increases. The resistance at $84.50 looks like it will be hard to break since LTC has been trading in a range of $83.50 and $84.01 for the past few hours.
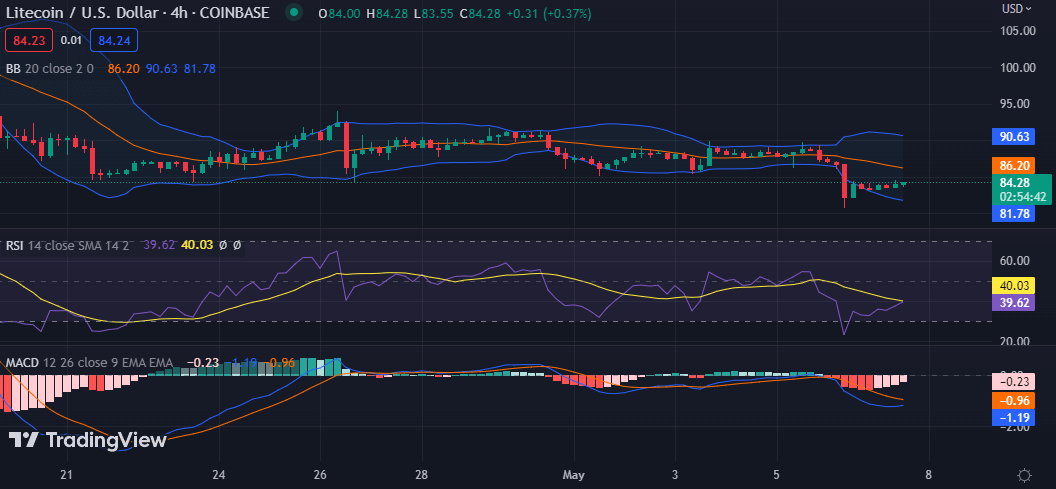
The technical indicators are also signaling a positive trend in the hourly chart. The RSI is rising and has moved to the 39.62 level, indicating that buying pressure is building up. The Bollinger Bands are also widening, showing that the volatility is increasing. The upper band is at $90.63, and the lower band is at $81.78. The MACD is still in negative territory but shows signs of a positive trend if recent developments continue.
Litecoin price analysis conclusion
In conclusion, Litecoin price analysis is bullish today with the bulls in control of the market. The resistance at $84.50 could prove to be a difficult hurdle for them to overcome. On the other hand, the support levels are also strong enough to provide room for corrections if needed. The technical indicators also suggest an upward trend, which may continue if current developments continue.
Disclaimer. The information provided is not trading advice. Cryptopolitan.com holds no liability for any investments made based on the information provided on this page. We strongly recommend independent research and/or consultation with a qualified professional before making any investment decisions.