Litecoin price analysis confirms the bearish trend for today, as the selling pressure increases on the coin. The digital asset dropped by roughly 12.35 percent for the last 24 hours, and the LTC/USD pair is displaying a strong bearish momentum as bears push the price down to the $71.21 level. Despite some positive movement earlier in the day, the overall trend has been downward and is expected to remain so for the rest of the day. With strong resistance near $81.66, it seems unlikely that Litecoin will break out of its current range anytime soon. Thus, investors should be cautious with their investments and trade carefully.
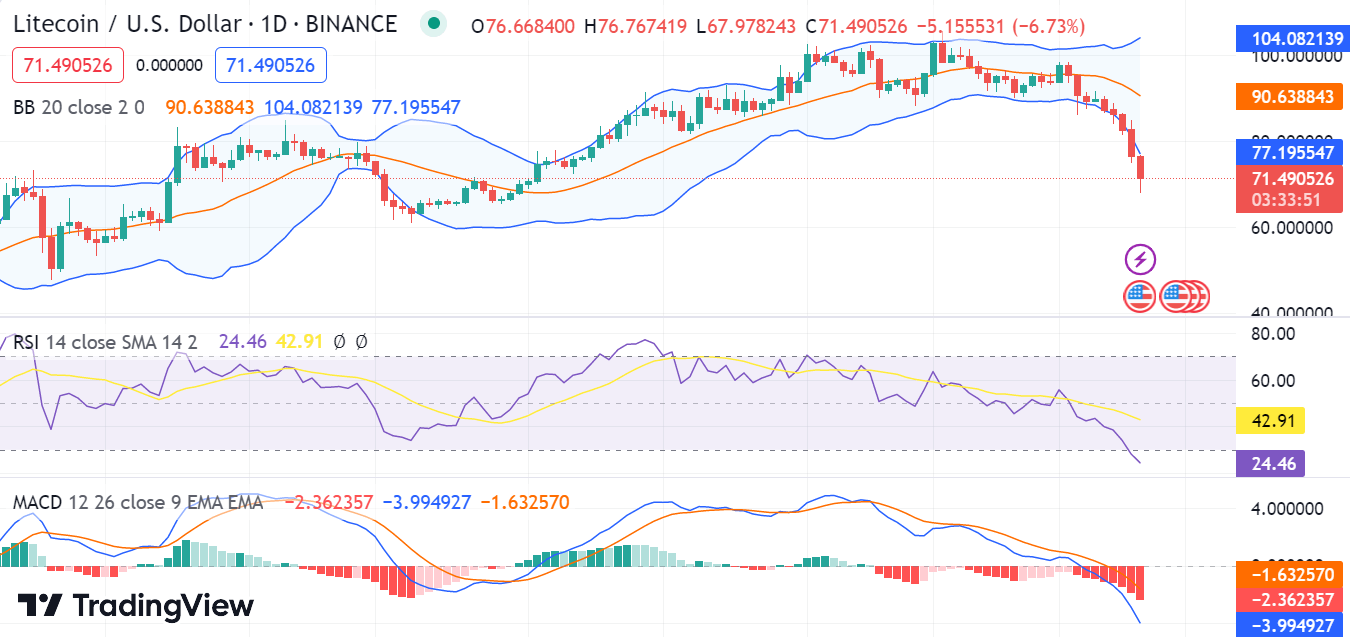
Litecoin price analysis 1-day chart
The one-day Litecoin price analysis predicts a bearish trend for the market as a sudden drop in price was observed today. Although the coin briefly rose earlier in the day, the upward momentum was quickly lost as bears tightened their grip on the market. The LTC/USD pair displays a bearish pattern with strong resistance near $81.66, if the bulls break this level then a further rally towards $81.70 and $82.12 is likely. The next major support for the pair is near the $69.16 level, below which it could plunge to as low as $70.98. On the upside, an initial hurdle for buyers appears near the $81.66 resistance area, above, and could surge to the $71.38 level before making another move

The relative strength index (RSI) is currently at 42 .91, which indicates that the coin is in a bearish zone. The MACD also confirms this downward trend as the signal line has crossed below the histogram and continues to drift downwards. The Bollinger bands are slowly contracting, which means that a further downturn in price is quite expectant. The upper value of the Bollinger Bands Indicator is now $104.082, whereas the lower value is now $77.195, representing high volatility for LTC.
LTC/USD 4-hour price chart: Recent updates
Looking at the 4-hour Litecoin price analysis chart, we can see that the coin is currently trading in a bearish zone. The four-hour price chart shows a red candlestick occupying the leading position, and the price is hovering around the $71.21 mark. Furthermore, the moving average convergence divergence (MACD) also supports this bearish trend as the MACD line has crossed below the signal line to form a bearish crossover pattern.

On the technical front, the volatility can be seen to increase following the enlarging of the Bollinger Band indicator. Precisely, the lower limit is placed on the $68.630 mark while the upper band is placed at $91.591, serving as the highest mark the price has reached in the near past. The relative strength index (RSI) score is currently 24.38, which reveals the oversold condition of the LTC/USD pair.
Litecoin price analysis conclusion
In conclusion, the Litecoin price analysis shows a bearish trend for today. Though the coin has seen some positive movement earlier in the day, it appears unlikely that it will break out of its current range anytime soon. Thus, investors should exercise caution and trade carefully to protect their investments.