Bitcoin Analysis
Bitcoin’s price dropped marginally despite BTC dominance rising on Tuesday and when traders settled-up for the day, BTC was -$283.7.
We’re beginning the new day with analysis of the BTC/USD 1D chart by Freedom_CN. At the time of writing, BTC’s price is trading between the 0.618 fibonacci level [$21,690.14] and the 0.786 fib level [$23,378.60].
BTC’s price has marked-up in value more than 36% over the last 30 days and bullish traders now want to eclipse the 0.786 fib level to continue their climb.
Above that level bulls have their sights set on 0.886 [$24,383.64], 1 [$25,529.38], 1.13 [$26,835.93], 1.272 [$28,263.09], 1.414 [$29,690.24], and the 1.5 fib level [$30,554.58].
Looking through a bearish lens those traders want to again push BTC’s price below the 0.618 fibonacci level with a secondary aim of 0.5 [$20,504.19].
If they succeed in cracking the 0.5 fibonacci level the next target to the downside for bears is the 0.382 fib level [$19,318.25]. Of course, to reach the 0.382 fib they’ll need to break the most critical level of inflection in existence on BTC’s chart [$19,891].
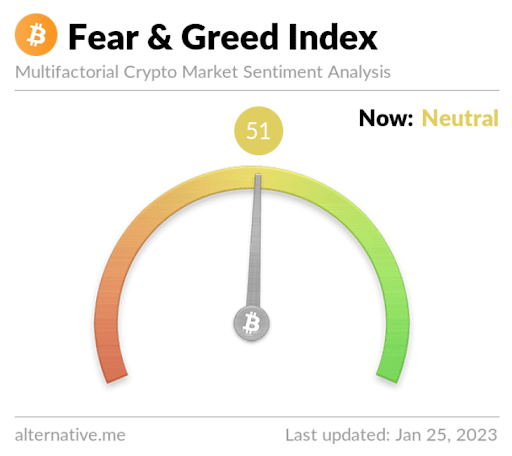
The Fear and Greed Index is 51 Neutral and is -1 from Tuesday’s reading of 52 Neutral.

Bitcoin’s Moving Averages: 5-Day [$21,985.45], 20-Day [$18,846.36], 50-Day [$17,626.32], 100-Day [$18,564.89], 200-Day [$22,367.89], Year to Date [$19,249.18].
BTC’s 24 hour price range is $22,462.9-$23,162.2 and its 7 day price range is $20,670-$23,162.2. Bitcoin’s 52 week price range is $15,505-$48,162.9.
The price of Bitcoin on this date last year was $36,948.8.
The average price of BTC for the last 30 days is $18,675.9 and its +36.3% over the same span.
Bitcoin’s price [-1.24%] closed its daily candle worth $22,632.3 and in negative digits for only the second time over the last six days.
Ethereum Analysis
Ether’s price also traded lower when its session closed than at the day’s open and when the day’s candle was printed, ETH was -$70.56.
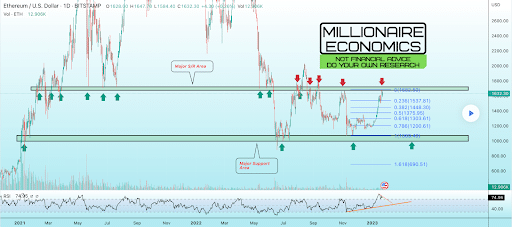
The ETH/USD 1D chart below via MillionaireEconomics is the second chart we’re looking at for this Wednesday. Ether’s price is trading between the 0.236 fibonacci level [$1,537.81] and the 0 fibonacci level [$1,682.50], at the time of writing.
Ether is also comfortably trading above its 2018 cycle high of $1,448 and bullish traders want to continue the ascent. The primary level that bullish Ether traders want to regain and control over the interim is the 0 fib level.
Bearish Ether traders contrariwise are hoping to send ETH’s price back down to retest the 0.236 fib level. If they’re successful there then bulls will be desperate to defend ETH’s 2017 ATH at the 0.382 fibonacci level. If bulls lose that level of inflection then bearish traders will be seeking to inflict further damage at the 0.5 fib level [$1,375.95].

Ether’s Moving Averages: 5-Day [$1,592.12], 20-Day [$1,389.14], 50-Day [$1,291.90], 100-Day [$1,352.48], 200-Day [$1,563.52], Year to Date [$1,423.75]
ETH’s 24 hour price range is $1,535-$1,641.46 and its 7 day price range is $1,511.24-1,646.13. Ether’s 52 week price range is $883.62-$3,579.96.
The price of ETH on this date last year was $2,458.27.
The average price of ETH for the last 30 days is $1,370.26 and its +32.87% over the same interval.
Ether’s price [-4.34%] closed its daily session on Tuesday valued at $1,555.97 and in red figures for a second straight day.
XRP Analysis
Ripple’s price followed the macro cryptocurrency market lower on Tuesday and concluded its trading session -$0.0161.
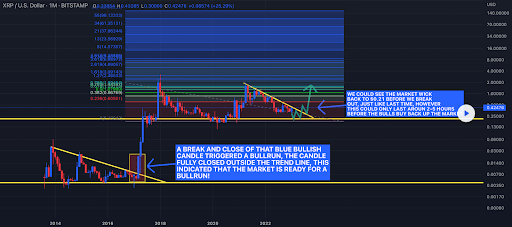
The last chart we’re analyzing for this Wednesday is the XRP/USD 1M chart below from ALTCOIN_BEAST. XRP’s price is trading between the 0 fib level [$0.18042] and 0.236 [$0.60501].
Those that are longing the XRP market are focused on these fib levels after the 0.236; 0.382 [$0.867], 0.5 [$1.079], and 0.618 [$1.292].
Bearish traders are conversely taking aim at the 0 fib level which would mark a multi-year low on XRP.

XRP’s Moving Averages: 5-Day [$22,010.97], 20-Day [$18,852.74], 50-Day [$17,628.88], 100-Day [$18,566.16], 200-Day [$22,368.53], Year to Date [$19,256.69].
Ripple’s 24 hour price range is $0.4025-$0.4312 and its 7 day price range is $0.3788-$0.4312. XRP’s 52 week price range is $0.2876-$0.9126.
Ripple’s price on this date in 2022 was $0.617.
The average price of XRP over the last 30 days is $0.367 and its +19.28% over the same period.
Ripple’s price [-3.80%] closed its daily candle on Tuesday worth $0.4079 and in red figures for the third time in four days.
