
Anna Bliokh
Produced in collaboration with Avi Gilburt and Ryan Wilday.
For those who have followed the work of myself and Ryan Wilday, you know that while Bitcoin (BTC-USD) has yet to reach our expected targets for rally patterns off of both the 2018 and 2020 lows, we still see the price action as constructive. Price has been in a larger holding pattern, denoted as a flat correction off the April 2021 highs, and the larger degree of support for this perspective continues to hold. Though micro setups have developed to take BTC back to $24k, price has evaded a deeper drop. BTC has not been able to push below $30k for any significant period of time before attracting an excess of buyers who push price back up. In short, expectations for higher targets described in my various articles entitled with some iteration of “Moonpath,” still appear to be very much on track.
The guidance that we provide in Crypto Waves tends to center around Bitcoin as the core holding among digital assets, and we tend to strike a position of caution around both over-allocating into alt-coins and holding altcoins as longer-term investment. Nevertheless, we do track selected altcoins for the purposes of high-quality trade setups (not long-term investments) and view them as having a prospect of offering some shorter-term outperformance (relative to 100% Bitcoin holdings) for selected coins during specific periods.
This miniseries of articles focuses on three well-known higher market cap altcoins that demonstrate higher probability of outperformance and expectation of new all-time highs in the next bullish cycle. These are Binance Coin (BNB-USD), Polygon (MATIC-USD), and Aave Liquidity Protocol (AAVE-USD).
Since the previous article, price has strongly broken down. Not only was the long-term support level $24k reached, it was resoundingly exceeded to the downside, testing beneath $18k. As such, our longer timeframe analysis, while still quite bullish, now favors only one more swing up to new all-time highs before a much longer-term correction. As for the altcoins presented in this series, BNB, MATIC, and (upcoming) AAVE, longer-term support for new all-time highs has maintained nicely.
This article, Part III, focuses on AAVE
Before discussing AAVE:
Please note, we view entries in alt-coins as speculative and unproven and so “best practices” would be to view holding as trades rather than investments and for allocations to be quite minimal given both the risk and the reward.
AAVE is a decentralized finance – DeFi – platform built on the Ethereum network that facilitates trustless cryptocurrency loans actualized via Smart Contract to execute loans. Users of AAVE are able to participate as either lenders or borrowers. Lenders deposit funds into a liquidity pool for interest, and borrowers are able to take a loan from the pool and pay interest on the funds borrowed. Borrowers are able to post a variety of other digital assets, i.e. different crypto currencies, from several networks as collateral for the loans they take. This form of decentralized platform is intended to democratize and decentralize lending and borrowing away from traditional banks.
Though there are many other cryptocurrencies that facilitate DeFi lending/borrowing, AAVE is one of the largest hubs for such transactions in the space. The AAVE token is both a governance token and an exchange token, and possession conveys voting power on any issues or prospective changes to the protocol, as well as discounts on any of the fees associated with using their platform.
From an Elliott Wave perspective (please see the attached charts for reference / visual aid):
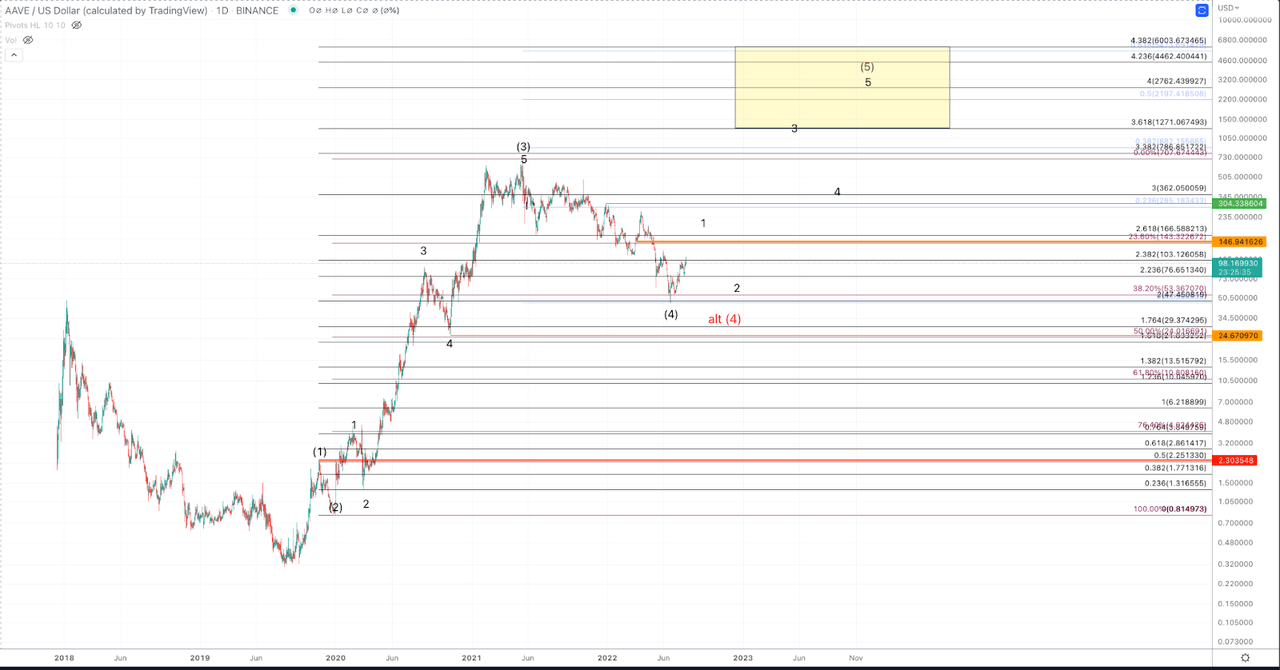
AAVEUSD Daily Chart (Jason Appel (Cryptowaves))
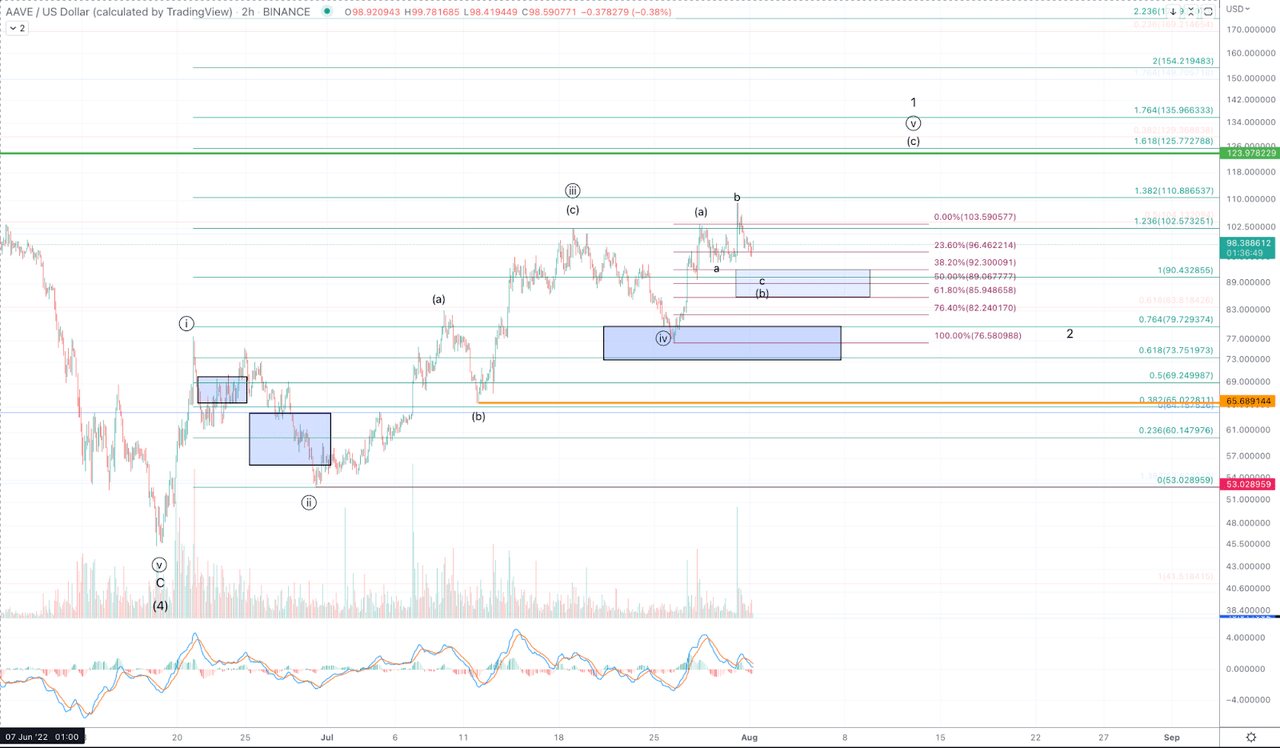
AAVEUSD 4h chart (Jason Appel (Cryptowaves))
Elliott Wave Theory describes trends in market prices as 5 wave formations. An impulse is a type of 5 wave formation that denotes a strong trend in which market participants are eagerly (hence: “impulsive”) pushing price primarily in one direction. In the case of uptrends, action is characterized by strong buying with participants chasing price higher as the lower priced “inventory” gets bought up. The waves that advance price in the direction of the trend, called “motive” waves are labeled 1, 3, and 5, and those that correct a portion of the previous advance are known as “corrective” waves and occur in the wave 2 and wave 4 positions. In an impulse, by definition, all the motive waves are themselves formed in 5 wave movements with wave 3 typically being the largest and strongest trending advance, and the wave 1 and 4 never overlapping.
The AAVE daily chart is a textbook exemplar of the previous description of an Elliott Wave Impulse and very much fulfills all of the characteristics. That said, only 3 waves up have completed thus far (labeled (1)-(2)-(3)), and so the Elliott Wave view of this chart is that it’s a currently incomplete impulse but one that shows great promise to complete by filling out its wave (5) to a new high.
Observing the Daily chart: From the 2019 low, AAVE formed an initial 5 wave impulse labeled (1) into the November 2019 high. From there price pulled back correctively, retracing only a portion of the (1) into the December lows: wave (2). Following wave (2) AAVE took off to the upside in a massive third wave rallying over 300x from the top of wave (1) to the high of wave (3). Notice as well, that the wave (3) rally is a clear 5 wave movement.
The strict rules for price to maintain an impulsive pattern after the first 3 waves up (assuming those 3 waves are satisfactory for their portion of an impulse) is that price cannot overlap into wave 1 territory in the wave 4. In practice, we need to consider some closer supports after a particularly extended 3rd wave, as it would not be suitable to wait for price to reach $2.30 (the wave (1) high) to indicate the impulse is dead. Our rough heuristic for this is to note that a 4th wave in an impulse should make no sustained break beneath the 50% retrace of the (3). That said, the ideal wave (4) support is the 38.2% retrace of wave (3).
With regard to AAVE, price has formed a clear 3 wave decline from the all-time high struck in May of 2021. Please see the micro chart for the displayed labels of the ABC down into the expected wave (4) low right into the 38.2% retrace at the June 2022 lows. From here, we look for evidence of a low in place. In order to provide sufficient evidence of a low having been struck and price heading up in wave (5), we need price to fulfill all of the following items on the list.
1) An initial 5 waves up
2) Pullback and successful test of support maintaining above the low preceding the 5 up
3) A takeout of the high of 5 up.
4) A takeout of wave iv of C high as resistance
Though it’s of course possible and in this case favored that the wave (4) low has been struck, that narrative is as of yet unconfirmed. Assuming confirmation via fulfilling all the items in the aforementioned list, it becomes very likely that the low is in and price is on its way up to higher highs without breaking the June 2022 low.
Considering that AAVE has nicely maintained the 38.2% retrace of the previous wave (3) advance and very nicely formed impulsive structure preceding this year+ pullback from all-time highs, these are the technical reasons to consider AAVE as a more likely candidate for further advance to a higher high to complete its wave (5).
As noted the wave (4) low is unconfirmed, and though we may consider an initial 5 up for wave 1 of (5), that’s as of yet likely incomplete even without consideration of the other as of yet unfulfilled items. This chart can sustain a lower low this year, but should that low take price beneath $24, the setup for higher highs becomes increasingly compromised. Please note, $24 is not a level that would invalidate the setup. It’s a loose “stop” of sorts, but the longer and deeper price moves beneath that level, the less likely recovery becomes.
As for the prospective wave (5), in terms of the Fibonacci proportions that are tracked to dial-in targets, it’s typical to see the wave (5) reach at least the 50% extension of waves (1)-(3). Based on the AAVE chart, if we do in fact have a low in place for (4), the 50% extension occurs at $2170 which is more than 21x from current price. Based on the magnitude of wave (3) relative to the initial (1)-(2), reaching just shy of 3.382 extension, minimal expectations, should a higher high be seen, are for price to reach the 3.618 extension at $1270. As such, even though entries following this methodology (and quite frankly Cryptocurrencies as an asset class) entail large downside risk, the overall risk to reward for entries in AAVE is quite favorable. As a reminder, we view entries in alt-coins as speculative and unproven and so, please remember that “best practices” would be to view holding as trades rather than investments and for allocations to be quite minimal given both the risk and the reward.